When it comes to growing your WooCommerce store, understanding your eCommerce data is very important. By understanding your eCommerce store’s data and numbers, you can apply several strategies to make your store profitable. However, this is easier said than done if you can’t use an accurate data tracking tool like WooCommerce Analytics.
In this comprehensive article, you’ll learn about the ins and outs of WooCommerce Analytics. Plus, you’ll also learn how to make actionable marketing strategies from Analytics with the help of a tool like Customer Ray.
WooCommerce Analytics: An Overview
Basically, WooCommerce Analytics is a built-in data analysis tool capable of generating accurate reports about. You can consider WooCommerce Analytics as a reliable all-in-one suite with modifiable features.
What Are the Benefits of Using WooCommerce Analytics?
Using WooCommerce Analytics offers numerous benefits for your store. In a way, your store will have little progress without WooCommerce Analytics because of insufficient data-gathering.
The primary benefit of WooCommerce Analytics is accurate data reporting. The tool will give you numerous customer insights such as purchasing signals, total sales, download data, and even store performance within a date range. By studying these insights, you can adjust your marketing strategies to fit the purchasing decisions of your customers. WooCommerce Analytics offers a simple dashboard view and an advanced view for better reporting.
WooCommerce Analytics will also help you make better inventory decisions due to its detailed product reports. You will know which products are selling fast and which ones are moving really slow. Combined with a useful plugin like Reserved Stock Pro, WooCommerce Analytics can optimize inventory management and prevent overselling and underselling.
The Limitations of WooCommerce Analytics
Even though WooCommerce Analytics offers in-depth data reports and numerical graphs, it can’t implement a deep dive on customer behavior. WooCommerce Analytics doesn’t have a detailed ‘customer overview page’ that can be insightful for adjusting strategies based on specific marketing personas (or profiles).
In other words, WooCommerce Analytics gives you the numbers but these numbers don’t necessarily translate to exact customer spending habits or preferences. At best, you can only get statistical data lumped according to a predefined date range.
Customer Ray fills the gap by helping you understand customers individually. The tool offers high-tier analysis with insightful segmentation, as well as the function to export customer segments through CSV. Some of the insights covered by Customer Ray are shopping days and busy time frames on a customer level. It’s like having detailed reports about your store’s customers!
Lastly, Customer Ray will have powerful AI integrations in the future. As you’re probably aware, AI has become prevalent today and it can be used across all possible industries. With AI, Customer Ray can even deliver better results while saving your time.
The Important Parts and Features of WooCommerce Analytics
WooCommerce Analytics has different parts and features that can be accessed by the store admin. We’ll cover the most important parts of WooCommerce Analytics in this section.
WooCommerce Analytics Dashboard
The WooCommerce Analytics dashboard is the place where you can access the data reports relevant to your store. This dashboard is customizable, allowing dynamic views of reports and data. You can freely adjust the dashboard sections according to your analytical preferences.
The Performance Indicator is an important part of the WooCommerce Analytics dashboard. It shows a general overview of your store’s metrics such as total sales, total orders, and variations sold. Checking the Performance Indicator section will give you an idea of your store’s day-to-day performance.
The Charts section contains in-depth charts that represent the measurable categories of your store. Viewing the dashboard charts is a great practice because it will allow you to compare store performance based on specific date ranges.
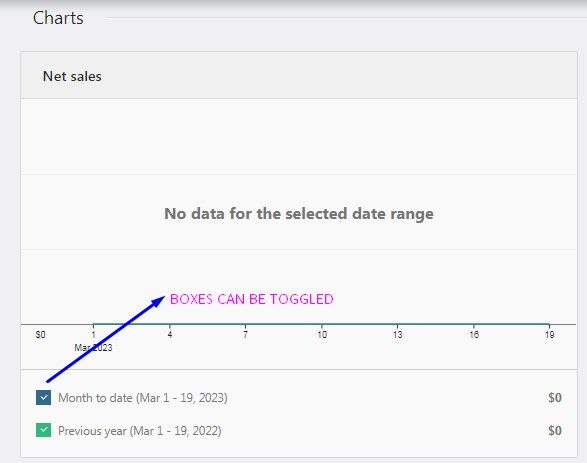
In the picture above, you can see the colored boxes under the charts. Simply click the boxes to set the predefined date range for any chart. The available options are month-to-date and previous year.
Similar to digital scoreboards, the WooCommerce Analytics Leaderboards section shows the top-performing metrics of your store. These metrics are Number of Orders, Top Customers, Top Categories, and Items Sold. We’ll go over these leaderboard sections one by one.
The Number of Orders pertains to the order coupons received by your store every day. This is a strong indicator of how your store is doing when it comes to general traffic and gross profit overview.
The Top Customers metric shows your store’s best customers and their total spending. This metric will possibly give you insights about the best customer groups to target for marketing.
Top Categories is all about your store’s most popular categories. The common factors affecting a category’s popularity are customer spending and product page visits.
And lastly, the Items Sold metric shows the overall items sold by your store.
WooCommerce Analytics Settings
WooCommerce Analytics comes with several important settings that can change the way data is presented in your dashboard. Customizing these settings will help you get the most out of WooCommerce Analytics.
Excluded Statuses
The Excluded Statuses setting shows the reports that are excluded from your WooCommerce Analytics dashboard. Clicking a status box will exclude the corresponding category from the report of totals.
Actionable Statuses
Actionable Statuses are parts of a store’s process and require input from the store admin. The statuses also appear in the Analytics home screen, just like online notifications that need confirmation steps.
Importing Historical Data
WooCommerce Analytics imports historical data to populate all report pages. As a store administrator, you can manually import historical data based on the date range that you want. WooCommerce Analytics will import all data if there’s no indicated date range.
The speed of historical data importing depends on the total volume of the store. One good thing is that the importing process won’t be interrupted even if you decide to view another store page.
How to Analyze WooCommerce Reports?
WooCommerce Analytics reports can be overwhelming at first glance because they contain lots of numerical data and graphs. However, you can analyze the reports effectively by understanding their classifications.
Single and All Products Reports
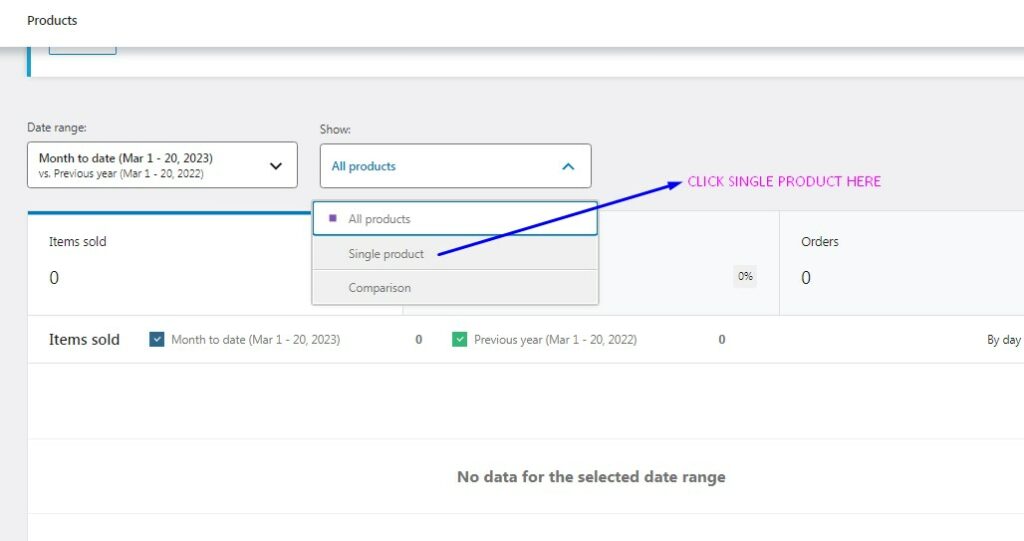
WooCommerce Products reports can be viewed through a single display or an all display.
The single report display is great for analyzing the performance of individual store products. Numerous data points are covered by the report such as items sold, active orders, net sales, and comparison checkboxes. The checkboxes are useful for comparing multiple products.
The All Products display is the normal view that you’d see in the WooCommerce Analytics dashboard. This efficient display is an aggregation of the performance level of all products in your store.
Order Reports
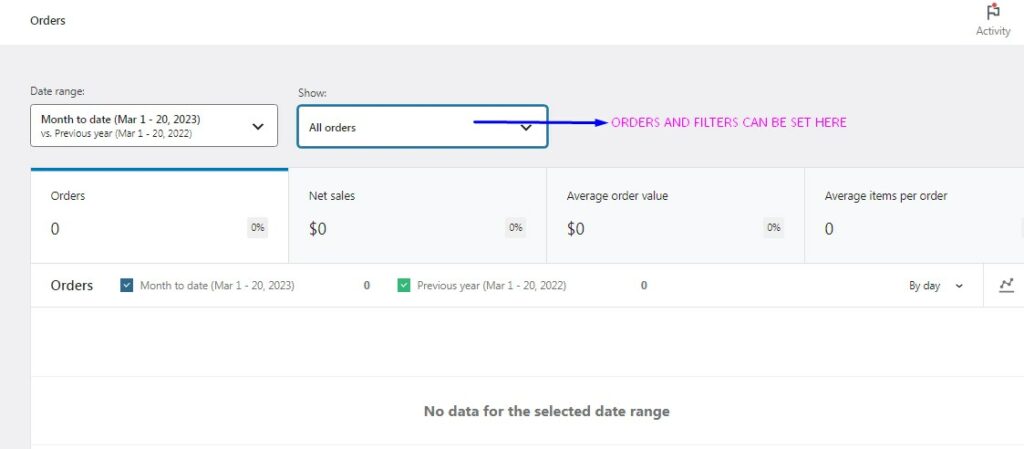
The Order Reports show detailed information about the recorded orders in your store. Some of the orders covered are completed orders and refunded orders. A filter is also available for sorting order types within the display.
Coupons and Discounts Reports
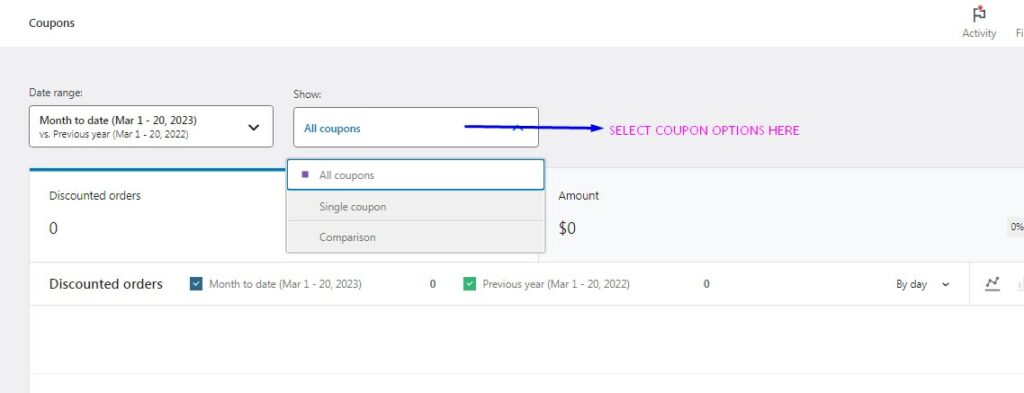
The Coupons and Discounts Reports are essential for planning future coupon launches and discount scheduling. In this display, you can see and modify the active coupons and product discounts.
Tax Reports
The Tax Reports display is important for showing the general profitability of your store. From the display, you’ll see gross sales, tax deductions, shipping fees, returns, and net sales. If your store is thriving, you might end up reviewing tax reports often!
How to Optimize Your Store Performance with WooCommerce Analytics?
Now that you have a basic understanding of what WooCommerce Analytics can do, let’s explore how you can use it to optimize your store’s performance in 2023.
Here are some important tips:
Monitor Your Store’s Performance
By regularly checking your sales, product, and order reports, you can identify useful in your store’s performance. This information will help you make informed decisions on properly optimizing your store. Monitoring your store is also beneficial for setting monthly or yearly profit milestones.
Identify Your Best-Selling Products
Use the Products Report to identify your top-selling items, and then focus your marketing efforts on promoting these products. You can also use the report’s data to optimize your pricing strategy and product descriptions. Make sure that your product descriptions are concise yet appealing enough to attract customers.
Optimize Your Marketing Strategies
The Sales report can help you identify which marketing strategies are generating the most revenue for your store. Use this data to optimize your marketing strategy so that you’re focused on the most profitable and effective campaign efforts.
Final Reminders
Knowing the foundations of WooCommerce Analytics will help you become a better store owner or administrator. The data presented by WooCommerce Analytics is invaluable, and it can serve as a major guiding point for your marketing strategies. Additionally, WooCommerce Analytics will help you make important decisions about inventory management, stocking, and cost adjustments.
