
So you’ve read my detailed introduction into A/B testing and set up your first test. You’ve compared a red button to a blue button and found that more people clicked the red button than the blue button. Seems like a good time to switch to a red button, right? WRONG!
Sure, you’ve observed a difference in conversion rate, but was that difference really due to you changing the button color? How do you know that your result is statistically significant enough to say with confidence that the red button is better than the blue button? What if your result was just due to random chance?
We use the p-value to help us determine if what we did actually worked!
The p-value won’t tell you whether the red button performed better or not, but it will tell you how likely it is that your results were just due to random chance, which is a really important statistic to know.
We could just chuck all our numbers into an online calculator and trust that they’ve got their numbers right. But because we’re really serious about getting this right, we’re going to dive in and get an understanding of the calculations themselves.
So here goes…
To get the p-value, we first have to calculate the chi-square statistic. The chi-square statistic is good for datasets where you have independent categories and you’re trying to see if they relate to each other. For example, comparing a blue button versus a red button to see if people click more on one than the other. My categories are red/blue and click/non-click.
The chi-square test is one way to tell if the results you observed are statistically significant or more likely to be a result of random chance.
The chi-square is based on the difference between what you observe in Group A and B in your dataset versus what you should expect to see if there is no difference between Group A and Group B.
For example, if you did an A/B test and observed that more people clicked the red button than a blue button, the chi-square statistic would answer the question: How confident can I be that reason more people clicked the red button wasn’t just down to random chance?
Before we begin: Know your hypothesis
I’m assuming since you’re at the chi-test stage, you already have a hypothesis. But just for a quick recap:
Whenever you’re testing something, you need a hypothesis and a null hypothesis. The hypothesis is what you expect will happen.
For example, in the case of the red vs blue button, our hypothesis will be: There is a relationship between button color and conversion rate, changing the button color to red will cause an increase in our conversion rates.
The null hypothesis is what we would expect to happen if our hypothesis is not true.
In the case of the red vs blue button, our null hypothesis will be: There is no relationship between button color and conversion rate, changing the button color will make no difference to conversion rates.
Step 1: Table your results
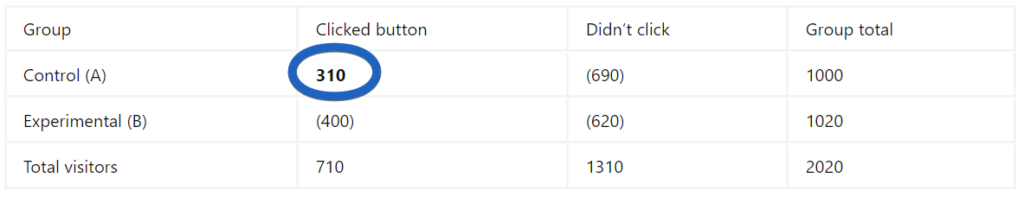
| Group | Clicked button | Didn’t click | Group total |
| Control (A) | 310 | 690 | 1000 |
| Experimental (B) | 400 | 620 | 1020 |
| Total visitors | 710 | 1310 | 2020 |
As shown in the table above, our we had 1000 people in our control group who saw the blue button. Of those 1000 visitors, 310 clicked the blue button and 690 did not.
In our experimental group, we had 1020 visitors who saw the red button. Of those 1020 people, 400 clicked the red button and 620 did not click the button.
Overall from both groups we had 2020 visitors, with 710 clicking a button and 1310 not clicking a button.
Step 2: Get the expected values
The expected results aren’t just numbers you pull out of the air and say you were expecting them. They are the results that we would expect of our test audience if there was no relationship between the variables we’re testing (in other words, if our null hypothesis was true).
In our red vs blue button example, these values represent the amount of clicks and non-clicks you would expect if there was no relationship between the red button and the blue button and the amount of clicks.
The formula for this is
row total X column total
_________________________
total visitors overall
To find out expected clicks for Group A
Note: I’m rounding to the nearest .5 here.
1000 (group A total size) X 710 (total visitors that clicked)
____________________________________________________________   =    351.5
          2020 (total visitors overall)
To find out expected non-clicks for Group A:
1000 (group A total size) X 1310 (total visitors that didn't click)
_________________________________________________________________ =    648.5
          2020 (total visitors overall)
To find out expected clicks for Group B:
1020 (group B total size) X 710 (total visitors that clicked)
____________________________________________________________   =    358.5
          2020 (total visitors overall)
To find out expected non-clicks for Group B:
1020 (group B total size) X 1310 (total visitors that didn't click)
_________________________________________________________________ =  661.5
          2020 (total visitors overall)
This table represents the number of clicks we would expect to see in each group if there was no difference between our two groups.
| Group | Clicked button | Didn’t click | Group total |
| Control (A) | 351.5 | 648.5 | 1000 |
| Experimental (B) | 358.5 | 661.5 | 1020 |
| Total visitors | 710 | 1310 | 2020 |
Why do we need to know the expected values? The expected values show us what our numbers would look like if there was no difference in behaviour between the two groups of people. It’s important that we look at the overall picture, and not just numbers in isolation. We could easily see that more people clicked the red button than the blue button, but there was also more people who saw the red button, so we can’t say just from the intial numbers that our result means anything. When analysing data, we have to make sure we’re looking at the overall picture and not coming to wrong conclusions.
Step 3: Calculate the Chi-Square
Now we get to the fun part. This is where we start comparing the difference between our observed results and the expected results. So basically, we’re comparing these two tables:
Observed results
| Group | Clicked button | Didn’t click | Group total |
| Control (A) | 310 | 690 | 1000 |
| Experimental (B) | 400 | 620 | 1020 |
| Total visitors | 710 | 1310 | 2020 |
Expected results (if the null hypothesis was true)
| Group | Clicked button | Didn’t click | Group total |
| Control (A) | 351.5 | 648.5 | 1000 |
| Experimental (B) | 358.5 | 661.5 | 1020 |
| Total visitors | 710 | 1310 | 2020 |
Why are we comparing the observed results to the expected results? We need to do this to see if our results mean anything. In other words, if we should believe that people really do prefer the red button than the blue button. We can see this by comparing our results to what the results should have been if there was no difference in behaviour between the people who saw the blue button and the people who saw the red button.
The equation for working out the chi-square statistic is:
(observed - expected)^2
_______________________
     expected
For group A clicks, the chi-square would be:
(310 - 351.5)^2
________________    = 4.90
   351.5
For group A non-clicks, the chi-square would be:
(690 - 648.5)^2
________________    = 2.65
   648.5
For group B clicks, the chi-square would be:
(400 - 358.5)^2
________________    = 4.80
   358.5
For group B non-clicks, the chi-square would be:
(620 - 661.5)^2
________________    = 2.60
   661.5
Table of chi-square results:
| Group | Clicked button | Didn’t click | Group total |
| Control (A) | 4.90 | 2.65 | 7.55 |
| Experimental (B) | 4.80 | 2.60 | 7.40 |
| Total visitors | 9.70 | 5.25 | 14.95 |
Now, we take the total number, which is our chi-square value, in this case 14.95. To get this number, you add up all four of your chi-squares. Once we have our total, we need to interpret what it means.
Step 4: Know your degrees of freedom
To analyze the chi-square number further, you need to know your degrees of freedom.
Degrees of freedom in this case tells us how many cells in a table we need to fill in order to be able to calculate the other ones, assuming we know the totals. It is basically a guide to how much information you need to know in order to be able to estimate the rest.
So if we look at our original table, you can see that we only need one value to be able to deduce all the others using the group totals:
The general rule for degrees of freedom is:
(number of rows - 1) X (number of columns - 1) = degrees of freedomIn our case, we have two rows (group A and group B) and two columns (click vs non-click). So our degrees of freedom will be:
(2 rows - 1) X (2 columns - 1) = 1 X 1 = 1Step 5: Understand the p-value
Finally, we’re going to turn our chi-square result into a p-value, which will mean something to us very soon!
The P in p-value means probability. The p-value tells us the probability of getting the results we got if the things we were measuring weren’t at all influencing each other.
For example, with our test of button color and conversion rates, the p-value will tell us the likelihood of us getting the observed results if there was actually no relationship between button color and conversion rate.
A p-value of .05 and less tells you that there’s a 5% chance of getting the observed increase in conversion with the red button if there was no relationship between button color and conversion rates. It means that our results are very surprising in a world where button color doesn’t influence conversion rates. Therefore, we say that our results are statistically significant. Your results are probably not due to random chance.
A higher p-value tells you that your results are not very surprising in a world where button color does not influence conversion rates. It means that the null hypothesis is more likely to be true and that our variables aren’t related to each other at all. Your results are most likely due to random chance.
For example, a p-value of .7 tells us that our results were more likely due to random chance, so we cannot say that our findings are statistically significant. We might need to increase our sample size or we might conclude that there is no relationship between button color and conversion rates.
A p-value of .05 tells us that our results are less likely due to random chance. It’s much more likely that the change in button color influenced the conversion rates.
Step 6: Get your results the old fashioned way
If you’d rather do this the easy way, skip to the next step.
I think it’s important to understand all the steps if you’re going to rely on statistics for business decisions. This means pulling out an old fashioned chi-square distribution table such as this one.
Find the degrees of freedom column and look for the number in that row that is the closest match to your chi-square value.
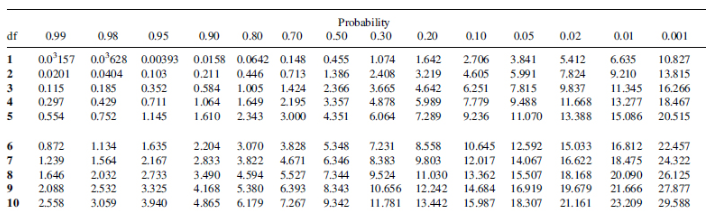
So, in our example, the chi-square value was 14.95, and we had 1 degree of freedom. In our case, with 1 degree of freedom, we can see that we need a chi-square value of 3.841 or above to get a p-value that tells us our results are statistically significant. Looking at the column on the far right, we can see that our p-value is less than .001, which is great!
We can say that our results were statistically significant. It is highly likely that our increased conversion rate with the red button was actually due to the change in button color. We better go fix our buttons!
Step 7: Get your results the easy way
If you don’t want to use the chi-square distibution table, you can put your chi-square value and your degree of freedom into an online calculator such as this one or this one. You will then get your p-value.
In our case, we put in our chi-square value of 14.95 and our degree of freedom, which was 1. And our p-value is .00011. Tiny!
Step 8: Act on your results
Now you know whether your results are statistically significant or not. Based on your p-value, you can decide whether to accept or reject the null hypothesis. Which is a fancy way of saying, you can decide whether or not to believe that the thing you changed is actually causing the outcome with your audience.
In our example, with a p-value of 0.00011, we decide to reject the idea that button color and conversion rates are unrelated. Our results are statistically significant and we believe that changing the button color to red was what caused an increase in conversion rates.
Next thing we need to know is the actual size of that effect!
A little break
I’ve done a lot of research on the topic of A/B testing and I believe it’s a good time to take a little break and hear what you guys think!
Have you implimented A\B testing with correct techniques and would you like me to continue the series? Keep me motivated by letting me know in the comments!